Put Option Payoff
A put option is the right, but not the obligation, to sell an asset at a prespecified price on, or before, a prespecified date in the future.
Long Put
The payoff diagram of a put option looks like a mirror image of the call option (along the Y axis). Consider a put option with a strike price of $97 and a premium of $3.
This diagram shows the option’s payoff as the underlying price changes for the long put position. If the stock is above the strike at expiration, the put expires worthless. The buyer of the put will have a loss of $3. As the stock price falls below the strike price ($97), the payoff from put option starts increasing. The option will breakeven when the stock price is equal to strike price minus the option premium, i.e., $97 - $3 = $94). As the stock price keeps falling, the profit from the long put position keeps increasing.
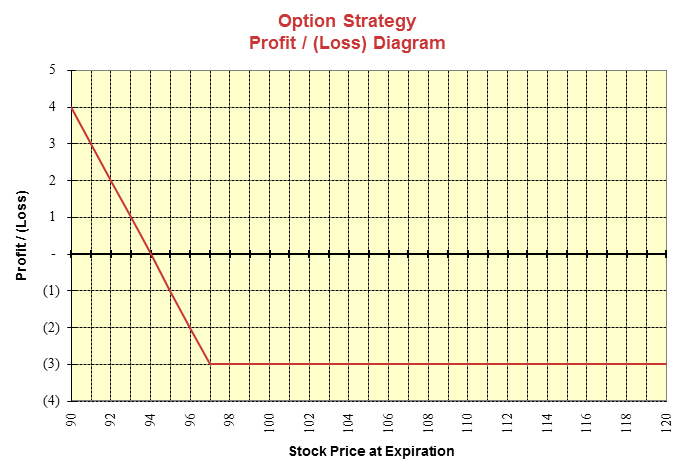
The profit/loss diagram for a long put position is summarized below:
- Maximum profit is equal to the strike price minus option premium (In our example, $97 - $4 - $94).
- Maximum loss is equal to the option premium paid,
- Breakeven point occurs when the Stock Price = Strike Price - Premium Paid
- The put option holder will exercise the option when the stock price becomes less than the strike price.
Short Put
The following diagram shows the put option payoff from the seller’s perspective (Short Put Position).
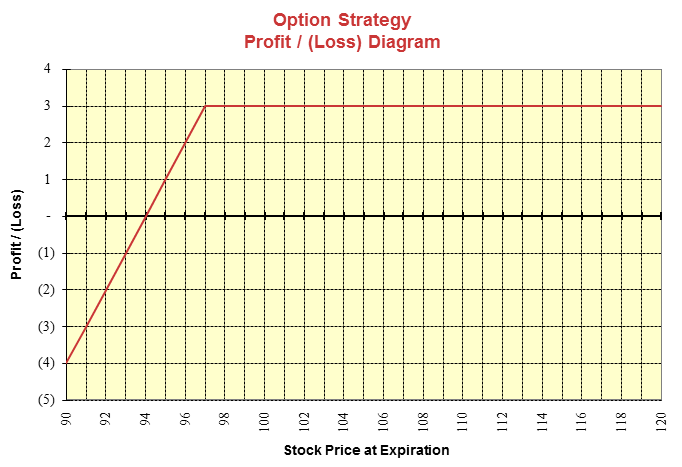
- The maximum profit is limited to the option premium received.
- Maximum loss is unlimited. The loss increases as the stock price decreases.
- Breakeven point occurs when the Stock Price = Strike Price - Premium Received