Plotting Volatility Smile in R
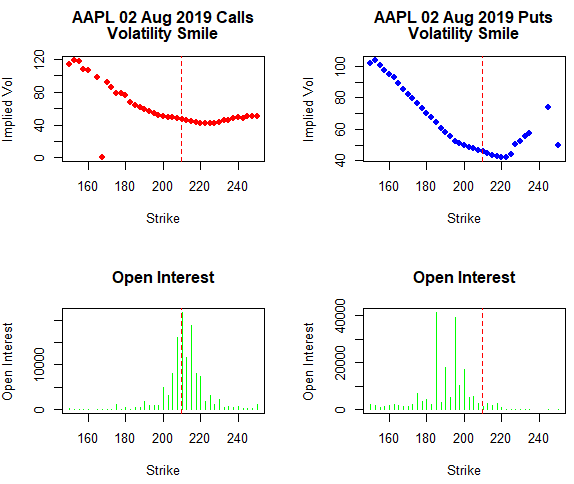
The main flaw of the Black Scholes model is that it assumes that the volatility of options contracts is constant for different strike prices. This assumption is not reflected in the real world where different strikes prices have different Implied Volatility values showing that investors and traders assign higher premiums for options that allow them to protect their portfolios.
Usually, the implied volatility values form a convex curve along the strike prices. This curve is called the Volatility Smile. This smile shape is formed because the market establishes higher values of implied volatility for in-the-money (ITM) and out-of-money (OTM) options compared to the implied volatility of the at-the -money (ATM) options contracts, that have lower values of implied volatility.
Some of the causes that explain this are the supply and demand of options from investors that demand high put contracts to protect their portfolios or traders and speculators that set strikes prices near resistance levels.
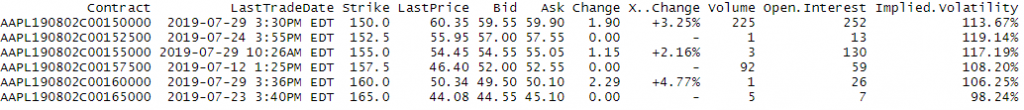
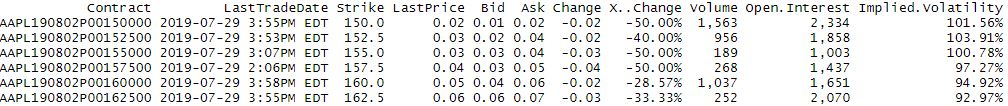
We would use two csv files with options data for call and put contracts for AAPL symbol and plot the volatility smile using R.
1# Get the two files that have the data for calls and puts at expiration date 02 August 2019. The source of these files is Yahoo Finance. https://finance.yahoo.com/quote/SPY/options