Parameters and Statistics
The number of asymptomatic cases in city A with Covid-19 was approximately half the population. Health practitioners couldn’t verify this by checking all members of the city’s population. They analyzed the data of asymptomatic patients in a few hospitals to arrive at a statistic. In this case, each hospital’s data is a sample that offers a number against the parameter. The value of the parameter is absolute but the statistic will vary based on the sample.
Parameters describe an entire population but since it is difficult to measure an entire population when it is large, the parameters of a large population are usually unknown. If we assume that it can be measured then the parameter has an absolute value.
To get an estimate about the population we can instead measure samples and arrive at statistical estimates that account for error to some degree. Such an estimate is called a sample estimate.
The sample estimate is therefore an estimated value for a sample that can be extrapolated for the population. Naturally, this value will not be true for every member of the population. Parameters are absolutes while statistics are estimates.
If the population is small, and each data point is collected from it, it is a parameter. When the population is too large to be counted and an inference is made based on a portion of the population, it is called a sample statistic.
80% of the children in school ABC have received their COVID booster shot. This is an example of a population parameter. Each child in the school has been surveyed and the relevant data collected.
85% of the school children in Southern India have received their COVID booster shot is a sample statistic. It is impossible to collect the data from all school students in South India and therefore the sample statistic is arrived at by collecting data from a sample of schools spread over Southern India.
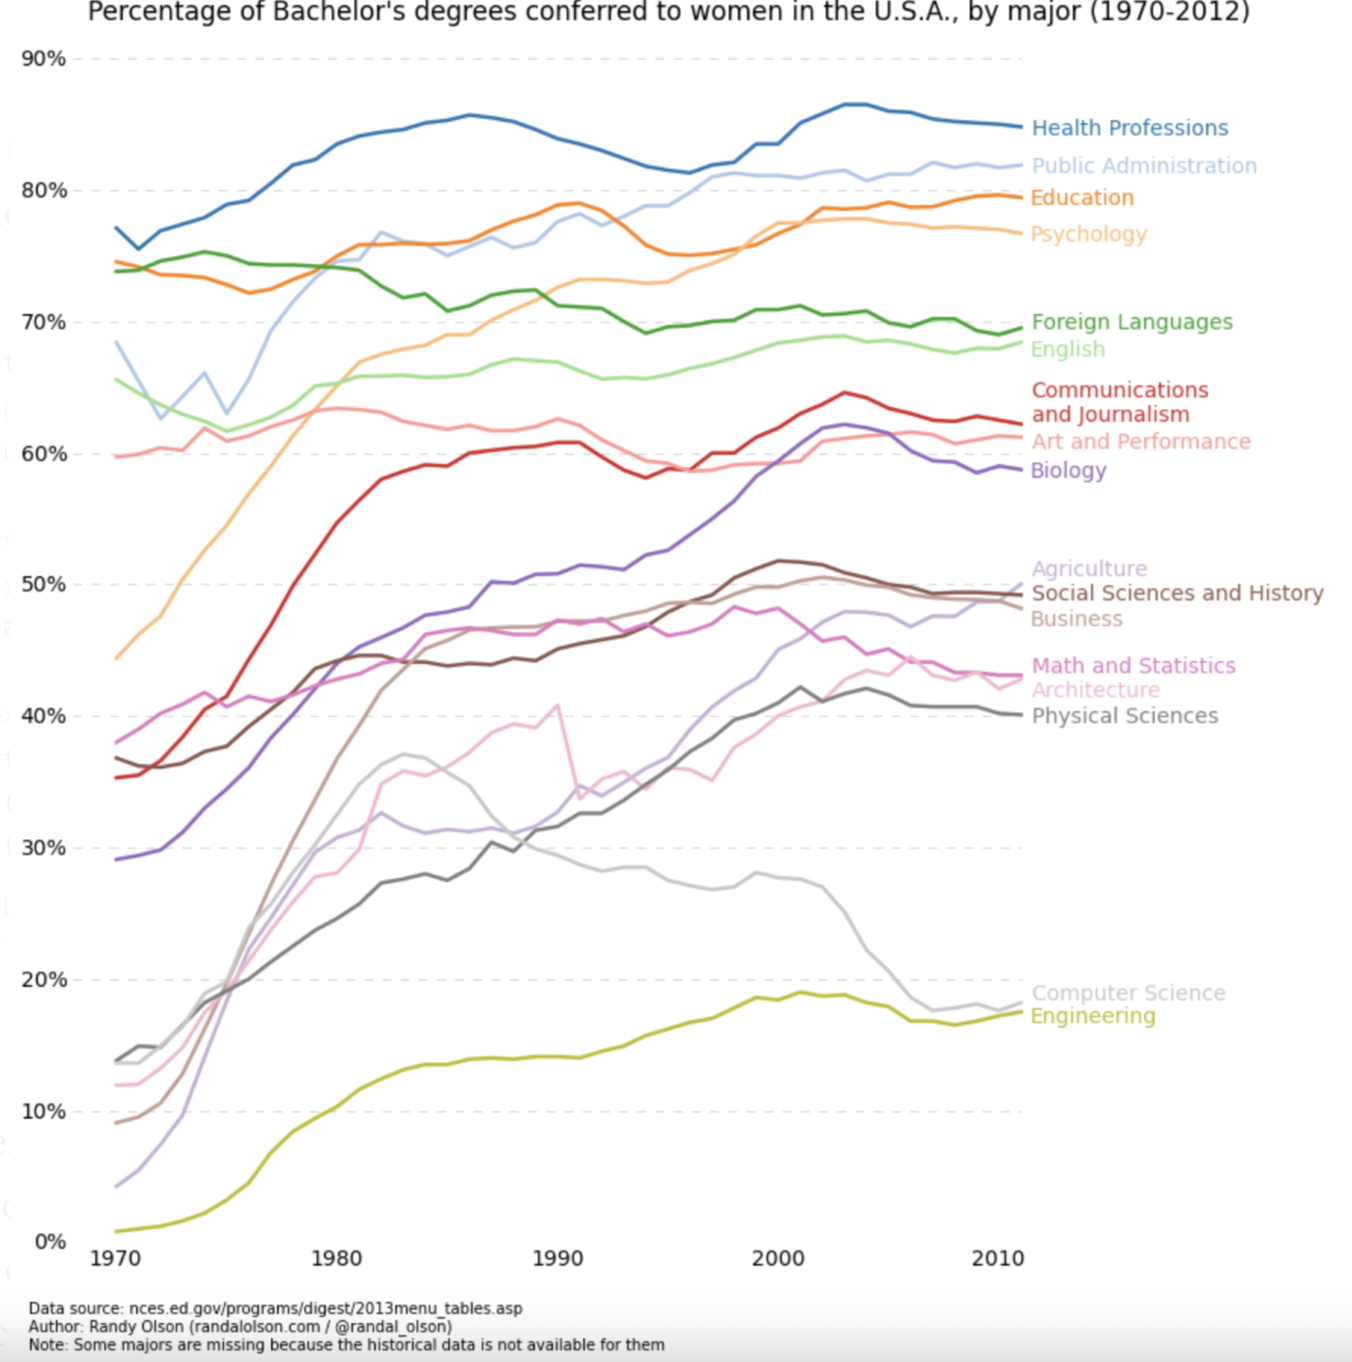
A data visualization of a statistic:

In this example, it is impossible to collect the data from the entire population. However, using primary and secondary sources of data the researchers have arrived at estimates for the population.

