Jensen’s Alpha Calculator in Excel
Downloads
Resources
Jensens Alpha Calculator Excel
Ask questions about this lesson and get instant answers.
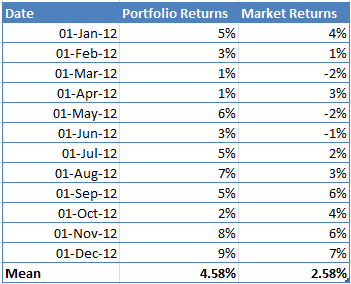
The Jensen’s Alpha is a popular risk-adjusted performance measure used by portfolio managers to determine how much excess returns their portfolio has generated over and above the market returns as suggested by the CAPM model.
A positive alpha indicates that the portfolio has outperformed the market, and vice versa.
The Jensen’s Alpha can be calculated using the following formula:
Where:
Let’s look at how Jensen’s Alpha can be calculated in Excel.
Step 1: Let’s say we have the following returns data for our portfolio and a benchmark index in excel. The first thing we need to do is calculate the mean of both the returns.

Step 2: Once we have the data, we need to define a risk-free rate. Let’s say the risk-free rate is 1.5%.
Step 3: The next step is to calculate the portfolio Beta, which will be used to calculate the expected returns using CAPM. Beta will be calculated using the following formula:
β = Covariance(Rp,Rm)/Variance(Rp)
Use the formula COVARIANCE.P(), and VAR.P() in excel to perform the above calculations.In our example, the value of Beta is 0.61.
Step 4: Now that we have the Beta, we can calculate the expected return using CAPM.
E(Rp) = 1.5%+0.61*(2.58%-1.5%)
E(Rp) =2.16%
Step 5: The last step is to calculate Jensen’s Alpha by subtracting the expected returns from the actual mean portfolio returns.
Jensen’s Alpha = 4.58% - 2.16% = 2.42%