Interpretation of Skewness, Kurtosis, CoSkewness, CoKurtosis
Kurtosis
It indicates the extent to which the values of the variable fall above or below the mean and manifests itself as a fat tail.
Within Kurtosis, a distribution could be platykurtic, leptokurtic, or mesokurtic, as shown below:
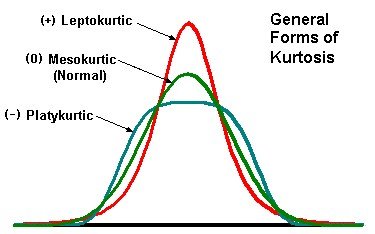
- If returns very high above or below the mean occur very frequently then the distribution is platykutic or exhibits high kurtosis. It has a flattened shape.
- If there are lesser returns high or below the mean and the frequency of occurences increases around the mean then the distribution shows low kurtosis in other words it is leptokurtic. This distribution has high peak.
- A mesokurtic distribution is one in which the returns do not exhibit any behaviour that is different from one without kurtosis. This type of distribution has a coeffecient of kurtosis of 3 which is the same as that of a normal distribution. This distribution is zero kurtosis excess.
If the coefficient of kurtosis is larger than 3 then it means that the return distribution is inconsistent with the assumption of normality in other words large magnitude returns occur more frequently than a normal distribution.
Skewness
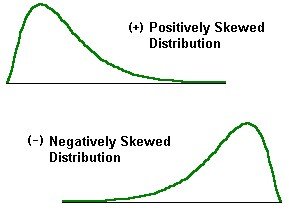
The frequency of occurrence of large returns in a particular direction is measured by skewness.
A distribution with no tail to the right or to the left is one that is not skewed in any direction. This is the same as a normal distribution i.e. a distribution which has zero skewness.
If there is a large frequency of occurrence of negative returns compared to positive returns then the distribution displays a fat left tail or negative skewness.
In case the frequency of positive returns exceeds that of negative returns then the distribution displays a fat right tail or positive skewness.
Fixed exchange rates like that of the Mexican peso or Thai Baht versus the dollar exhibit a large kurtosis because their values are kept pegged to each other within a certain range by monetary authorities. When a fixed rate regime is abandoned to increase the transparency in which the markets operate the fluctuations shown by the currency indicate very large positive or negative values as compared to the fixed rate period. In either case the kurtosis is high.