How to Download Stock Prices into Google Spreadsheets

This post provides an alternative to downloading stock prices in excel, for those who prefer to manage their portfolio in Google Spreadsheets.

Google Spreadsheets have become quite powerful and can be used to perform complex calculations and create dynamic dashboards. Just like in excel, you can import data from external sources into google spreadsheets. Let’s look at the different ways to do so. Open a new google spreadsheet and following the following steps.

Using Google Finance

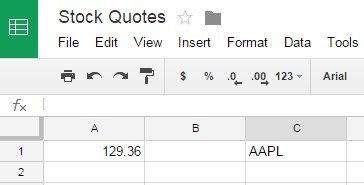
Let’s say you want to retrieve the last stock price for Apple. The symbol for Apple stock is AAPL.

In a cell type =GoogleFinance("AAPL","price")

The above function will fetch the current price for Apple stock from Google Finance.

The GoogleFinance function can be used to retrieve both current and historical information about the securities. The full format of the function is given below:

GOOGLEFINANCE(ticker, [attribute], [start_date], [end_date|num_days], [interval])
GOOGLEFINANCE("AAPL", "price", DATE(2012,1,1), DATE(2014,12,31), "DAILY")
  • ticket (Optional) – The first parameter is the ticker symbol of the security for which you want the information.
  • attribute (Optional) – The attribute is the information you want to fetch, for example, price, marketcap, volume, etc.
  • start_date (Optional) – The start date when fetching historical data.
  • end_date|num_days (optional) - The end date when fetching historical data, or the number of days from start_date for which to return data.
  • interval (Optional) - The frequency of returned data; either "DAILY" or "WEEKLY".

Using Yahoo Finance

You can also download the stock prices from Yahoo Finance. To do so, google spreadsheets come with a nifty function called IMPORTDATA that can be used to import data from a url in .csv/.tsv format. To retrieve the price of Apple stock from Yahoo finance, type the following function in Google Spreadsheet:

=importdata(“http://download.finance.yahoo.com/d/quotes.csv?s=AAPL&f=sl1d1t1c1ohgv&e=.csv”)

This will download all the information about the stock in the spreadsheet, including ticker name, last trade price, volume, etc.

Below is a description of the parameters:

  • s=AAPL is the symbol, in this case AAPL.
  • a=11 is the start month (0 for Jan, 1 for Feb, 2 for Mar, etc.). In our example it is December.
  • b=12 is the start day of the month. In our example, it is 12th.
  • c=2000 specifies the start year. In our case it is 2000. So, for the historical data, the start date is 12th December, 2000.
  • d=2 specifies the end month. In our case it is March.
  • e=4 specifies the end day of the month In our example it is 4th.
  • f=2014 specifies the end year. For us it is 2014.
  • g=w represents the frequency of the data returned. (d for daily, m for monthly, w for weekly). For us, it is daily.

I hope this information will help you manage your finances better. Please share in the comments below about how you retrieve and use this stocks data.

Membership
Learn the skills required to excel in data science and data analytics covering R, Python, machine learning, and AI.
I WANT TO JOIN
JOIN 30,000 DATA PROFESSIONALS

Free Guides - Getting Started with R and Python

Enter your name and email address below and we will email you the guides for R programming and Python.

Saylient AI Logo

Take the Next Step in Your Data Career

Join our membership for lifetime unlimited access to all our data analytics and data science learning content and resources.