Ask questions about this lesson and get instant answers.
We assume that people understand the choices available to them and the prices associated with each choice. They consider the alternatives available to them and choose the best based on their preferences.
When people have choices, it is possible to find the consumers preference for various products. Given a set of alternative products, we can rank these products in terms of consumer preference, which ones they like more and which ones less. This ranking in terms of preference is referred to as the utility. If product A is preferred over product B, then the consumer has more utility from A than from B. U(A) > U(B). in simple words, A provides more satisfaction than B.
We use utility theory to understand the behaviour of consumers based on their preferences for alternative combinations of goods.
The utility rankings are ordinal in nature, i.e., they measure the relative desirability of alternative bundles of commodities. The measures of utility are not unique, and therefore it does not make sense to consider how much more utility is gained from A than from B. For example, a consumer has a choice between two sets of alternatives. Alternative A has 2 bananas and 1 sandwich. Alternative B has 1 banana and two sandwiches. If utility from A is 10 and utility from B is 20, we can say that the consumer prefers B over. However, we cannot conclude that the consumer prefers B twice over A.
Another important aspect of utilities is that each consumer has his own utility from a bundle of commodities and it is also impossible to compare utilities between people.
The utility function for a bundle of products can be specified as follows:
U(QA,QB,QC…)
Q represents the quantity of each good. The utility function assumes that more is better, i.e., if we hold the quantities of all goods constant and increase the quantity of one good, the total utility will increase.
Since utility represents preferences of a consumer, if two bundles equally preferred by a consumer, they will have same utility for the consumer. This means that the consumer is indifferent between the two bundles. This leads us to the concept of indifference curves.
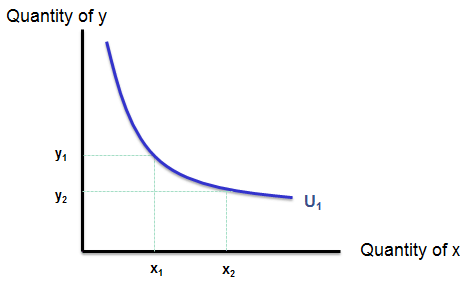
An indifference curve shows a set of consumption bundles among which the individual is indifferent.
The following is a sample indifference curve. All the combinations on this curve provide the same level of utility. For example, combinations (x1, y1) and (x2, y2) provide the same level of utility.
