Budget Constraints
We learned that indifference curve shows the bundle of goods that provide same utility to an individual and an individual will always want to maximize the utility.
However, most people are constrained by their income while making their choices. The budget constraint measures the combinations of purchases that a person can afford to make with a given amount of income. If we take two goods with given prices, a budget constraint shows the consumer’s purchase opportunities as every combination of these two goods that can be bought using a given amount of income.
Let’s say the income of an individual is m = 100. The price of Good 1 is P1 = 10 and the price of Good 2 is P2 = 20.
The budget constraint will be X1* P1 + X2* P2 = I, where X1 and X2 are the quantities of Good 1 and 2. In our example, X1*20 + X2*20 = 100
Using this information, we can draw a budget line as follows. The budget line shows the combinations of Good 1 and 2 that will use all the income.
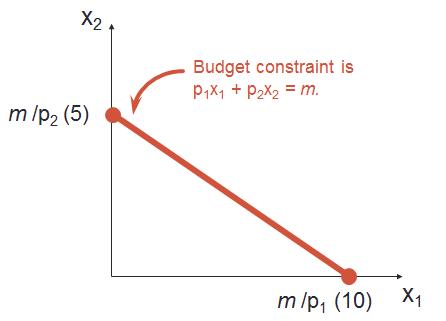
The person’s income is 100. If he buys 10 units of Good 1, then he will exhaust all his income in buying good 1 and 0 units of Good 2. Similarly if he buys 5 units of Good 2, he uses all his income in Good 2. All combinations of quantities for the two products are just affordable for the individual. Anything above the budget line is not affordable by the individual. The area below the budget line is called the budget set. It contains the collection of all affordable bundles. The slope of the budget line is -p1/p2.

The budget constraint and budget set depend upon prices of the goods and income of the individual. When either of these two change, the budget line will change.
Impact of Increase in Income
If the income of the individual increases, the budget line will shift outwards. A higher income gives more choices to the individual.

Similarly, when the income of the individual decreases, the budget line will shift to the left and affordable budget set will shrink and affordable consumption choices will reduce. There is no change in the slope.
