- Relational Operators in R
- Logical Operators in R
- Conditional Statements in R
- For Loop in R Programming
- While and Repeat Loop in R Programming
- Functions in R Programming
- Creating Functions in R
- Apply Functions in R
- Importing Data from External Data Sources in R
- Importing Data Using read.csv in R
- Import Data using read.table in R
- Importing Data Using data.table – fread in R
- Importing Data from Excel in R
- Using XLConnect in R Programming
- Importing Data from a Database in R
- SQL Queries from R
- Importing Data from Web in R
Importing Data from Web in R
While working as a data scientist, you will often deal with data stored on the web. Typically you will have a URl for the data and you will make an HTTP request to fetch the data. The data itself can come in many formats, such as:
- Files such as csv, delimited and excel files
- Data available through APIs. The most popular format of data available through APIs is JSON
- Data available in web tables inside web pages
- And many more
In this lesson, we will look at how to import data in R from files and from APIs. While there are many packages and techniques to get data from the web, we will introduce some of these to you.
CSV Files
Earlier we used read.csv() from theutils package to import CSV files stored locally. The read.util() function is equally efficient to load data from csv files stored on the internet.
For this lesson, we will use a csv files which contains fundamentals of the top 100 stocks in the US. The file is available below:
If you paste this URL directly in a web browser, the browser will simply download the CSV file. To import the data from this file into R, you will need to pass the URL instead of the local file path as shown below:
#Import the csv file into variable 'top_stocks'
top_stocks <- read.csv("http://financetrain.com/assets/course/data/top-100-stocks.csv")
#print top-stocks
top_stocks
The result will be exactly the same as you would import it from your local system.
Notice that the URL for the data starts with http (Hyper Text Transfer protocol). HTTP is the language of the web. It's a set of rules about data exchange between computers. Hyper Text Transfer Protocol Secure (HTTPS) is the secure version of HTTP, the protocol over which data is sent between your browser and the website that you are connected to. The 'S' at the end of HTTPS stands for 'Secure'. It means all communications between your browser and the website are encrypted. read.csv() is capable of handling both HTTP and HTTPS urls.
Tab Delimited Files
Just like we used read.csv() to import CSV files, we had used read.table() to import files containing data with some other delimiter such as tab or by blank characters. The following example shows usage of read.table() for importing data from a file containing tab delimited historical price data for Goldman Sachs stock.
#Import the csv file into variable 'top_stocks'
GS_Stock_Prices <- read.table("http://financetrain.com/assets/course/data/GS-Stock-Prices.txt", sep="\t", header=TRUE, stringsAsFactor=FALSE)
#print top-stocks
GS_Stock_Prices
Also take a look at the readr package which has many utilities to import data from flat files and works well with files on the web.
Excel Files
Earlier we learned about reading data from excel files using readxl, xlsx and gdata packages which are pretty good.
gdata can handle .xls files that are on the internet while readxl can't. gdata is good but it is not preferred by me because 1) it cannot handle .xlsx files and 2) installing the package also requires you to have a perl interpreter installed on your system, which makes it too much work. But if you need to, you can try it.
APIs
This is where the crux of interacting with web data lies. While loading csv, excel and other files is good and you will need to know about it, the majority of financial data that you will access from the web is available through APIs. In the rest of the lesson, we will focus on what APIs are and how to access data from them.
What is an API
An Application Programming Interface (API) is a set of commands, functions and protocols which programmers can use when building a software. It is a way in which different software components interact with each other.
An API can take many forms, however, we will focus specifically on Web APIs. A Web API as the name suggests, is an API over the web which can be accessed using HTTP protocol. A Web API can be used to pass a variety of information including structured and processed data which is what we are interested in. All major web applications provide access to their data through a Web API. For example, Facebook, Amazon, YouTube, and Twitter, all have very powerful APIs which can be used to fetch a variery of data from their servers.
There are also many Web APIs for financial data. One very popular service that provides access to financial data via a web API is Quandl. We will be using Quandl API to fetch some data in the examples below.
JSON
JSON (JavaScript Object Notation) is a lightweight data-interchange format. It is easy for humans to read and write. It is easy for machines to parse and generate. JSON is a minimal, readable format for structuring data and is widely used in APIs. All of the data from Quandl is available in JSON format, where all the data is available in a nice and structured format.
jsonlite
To convert json into an R data structure, we can use an R package called jsonlite. jsonlite is a fast JSON parser and generator optimized for statistical data and the web. The package offers flexible, robust, high performance tools for working with JSON in R and is particularly powerful for building pipelines and interacting with a web API.
Installing and Loading jsonlite
The first thing we need to do is to install and load the jsonlite package.
> install.packages("jsonlite")
> library(jsonlite)
Importing JSON Data
Once we have the jsonlite package installed, we are ready to import json from any Web API. For this example, we have taken a dataset from the Quandl API. It is a JSON file containing Daily Bitcoin exchange rate (BTC vs. EUR) on Kraken. The URL for the API request is as follows:
https://www.quandl.com/api/v3/datasets/BCHARTS/KRAKENEUR.json?api_key=<your-own-api-key>
You can try pasting this URL in your web browser to view the raw JSON file. Quandl API requires an API key to access the data. Notice that I have used an API key in the above URL - api_key=AKENEUR.json?api_key=<your-own-api-key>. You can create a free account on the Quandl website to get your own api key which you can use in all your API calls.
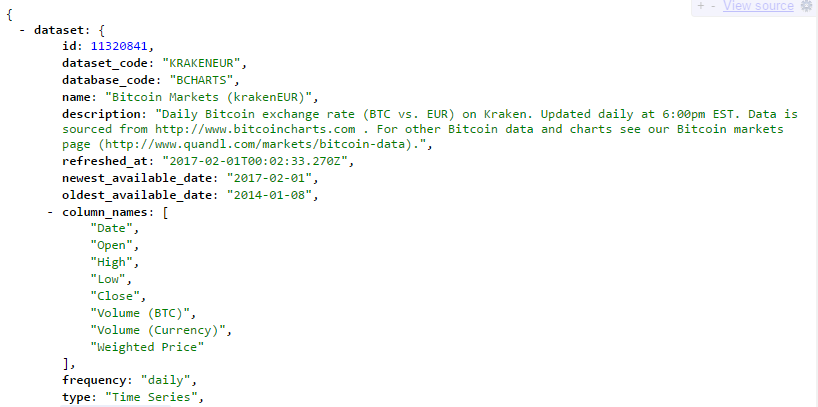
We can use the fromJSON function from the jsonlite package for importing the JSON file. Simply pass the URL as an argument in this function and it will download the data and convert it into a named R list.
> quandl_data <- fromJSON("https://www.quandl.com/api/v3/datasets/BCHARTS/KRAKENEUR.json?api_key=<your-own-api-key>")
> str(quandl_data)
List of 1
 $ dataset:List of 21
  ..$ id                   : int 11320841
  ..$ dataset_code         : chr "KRAKENEUR"
  ..$ database_code        : chr "BCHARTS"
  ..$ name                 : chr "Bitcoin Markets (krakenEUR)"
  ..$ description          : chr "Daily Bitcoin exchange rate (BTC vs. EUR) on Kraken. Updated daily at 6:00pm EST. Data is sourced from http://www.bitcoincharts"| __truncated__
  ..$ refreshed_at         : chr "2017-02-02T00:20:03.221Z"
  ..$ newest_available_date: chr "2017-02-02"
  ..$ oldest_available_date: chr "2014-01-08"
  ..$ column_names         : chr [1:8] "Date" "Open" "High" "Low" ...
  ..$ frequency            : chr "daily"
  ..$ type                 : chr "Time Series"
  ..$ premium              : logi FALSE
  ..$ limit                : NULL
  ..$ transform            : NULL
  ..$ column_index         : NULL
  ..$ start_date           : chr "2014-01-08"
  ..$ end_date             : chr "2017-02-02"
  ..$ data                 : chr [1:1122, 1:8] "2017-02-02" "2017-02-01" "2017-01-31" "2017-01-30" ...
  ..$ collapse             : NULL
  ..$ order                : NULL
  ..$ database_id          : int 8431
Now that you have all the data in an R list, you are ready to use it in your data analysis. As you can see, at the top level, everything is in a list named dataset which contains 21 elements. As an example, to retrieve the description of the data, we can use the following command:
> # Get the description of the data
> quandl_data$dataset$description
[1] "Daily Bitcoin exchange rate (BTC vs. EUR) on Kraken. Updated daily at 6:00pm EST. Data is sourced from http://www.bitcoincharts.com . For other Bitcoin data and charts see our Bitcoin markets page (http://www.quandl.com/markets/bitcoin-data)."
Similarly we can retrieve other pieces of information, for example, quandl_data$dataset$data contains the actual data we are interested in.
The jsonlite package is capable of many other things, which we will explore in detail as we learn more data science. You can also learn more about jsonlite from this vignette. I also suggest that you familiarize yourself with the JSON format. Here are some examples.
Lesson Resources
Free Guides - Getting Started with R and Python
Enter your name and email address below and we will email you the guides for R programming and Python.