Lessons
- What is Hypothesis Testing
- Test Statistic, Type I and type II Errors, and Significance Level
- Decision Rule in Hypothesis Testing
- p-Value in Hypothesis Testing
- Selecting the Appropriate Test Statistic
- Hypothesis Testing with t-statistic
- Hypothesis Testing with z-statistic
- Tests Concerning Differences in Means
- Paired Comparision Tests - Mean Differences When Populations are Not Independent
- Hypothesis Tests Concerning Variances
- Chi-square Test – Test for value of a single population variance
- F-test - Test for the Differences Between Two Population Variances
- Non-parametric Tests
Hypothesis Testing with t-statistic
t-statistic is the computed value of the test statistic based on the Student’s t distribution.
t-statistic with n-1 degrees of freedom is calculated as follows:
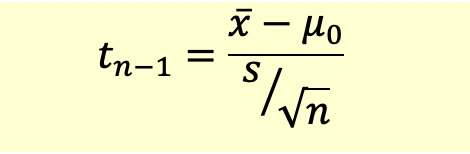
In the hypothesis test, we compare the t-statistic with the critical t-value at a given level of significance and appropriate degrees of freedom.
Related Downloads
Related Quizzes
Finance Train Premium
Accelerate your finance career with cutting-edge data skills.
Join Finance Train Premium for unlimited access to a growing library of ebooks, projects and code examples covering financial modeling, data analysis, data science, machine learning, algorithmic trading strategies, and more applied to real-world finance scenarios.
I WANT TO JOINJOIN 30,000 DATA PROFESSIONALS
Free Guides - Getting Started with R and Python
Enter your name and email address below and we will email you the guides for R programming and Python.