How to Read Student's t Distribution Table (With PDF)
Student’s t distribution table has the following structure:
The row represents the upper tail area, while the column represents the degrees of freedom. The body contains the t values. Note that for on-tail distribution the values are for a and for two-tailed distribution values are for a/2.
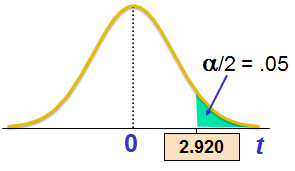
Let’s say n = 3, the df= 3-1 = 2. If significance level a is 0.10 then a/2 = 0.05. From the table we can observe that t-value = 2.920.
You can download the PDF file for t-table from the following link. You must be logged in to download the file.
