- Major Types of Return Measures
- How to Calculate the Holding Period Returns
- Portfolio Risk & Return - Part 1A - Video
- Portfolio Risk & Return - Part 1B - Video
- Arithmetic Returns Vs. Geometric Returns
- How to Calculate Money-weighted Returns
- How to Calculate Annualized Returns
- How to Calculate Portfolio Returns
- Gross and Net Returns Calculations
- How to Calculate Leveraged Returns
- Nominal Returns and Real Returns in Investments
- Calculate Variance and Standard Deviation of an Asset
- Standard Deviation and Variance of a Portfolio
- Efficient Frontier for a Portfolio of Two Assets
- Effect of Correlation on Diversification
- Risk Aversion of Investors and Portfolio Selection
- Utility Indifference Curves for Risk-averse Investors
- Capital Allocation Line with Two Assets
- Selecting Optimal Portfolio for an Investor
- How to Calculate Portfolio Risk and Return
- Portfolio Risk and Return - Part 2A - Video
- Portfolio Risk and Return - Part 2B - Video
Utility Indifference Curves for Risk-averse Investors
In the previous article we learned that different investors exhibit different levels of risk aversion. For each investor the degree of risk aversion translates into certain utility (read satisfaction) that he gets from an investment. In our example of $100 for sure vs. a gamble where you get $200 or nothing, when a risk averse chooses to go with $100 for sure, it means that the $100 with certainty provides him more utility compared to the gamble. For another person, even $90 may be good enough for him to find more utility compared to going for a gamble. However, if the certain amount is reduced more, say to just $20, then he might as well try the gamble option.
The risk-return utility function of an investor can be exhibited using the following formula:
U = E(R) – ½ A * Variance
Where:
- U is a given level of happiness/utility
- A is the level of risk averseness
We can make some interesting observations from this function:
- Utility increases as expected returns increase
- Utility decreases when variance or risk increases
- Utility reduces as risk-aversion (A) increases
As the risk aversion increases, an investor demands more return for every unit of increase in risk. When the risk increases, the investor demands more return based on his utility function, thereby keeping the level of utility the same. This concept can be explained with the help of indifference curve. An indifference curve presents the risk-return requirements of an investor at a certain level of utility. The following graph shows three indifference curves for the same investor.
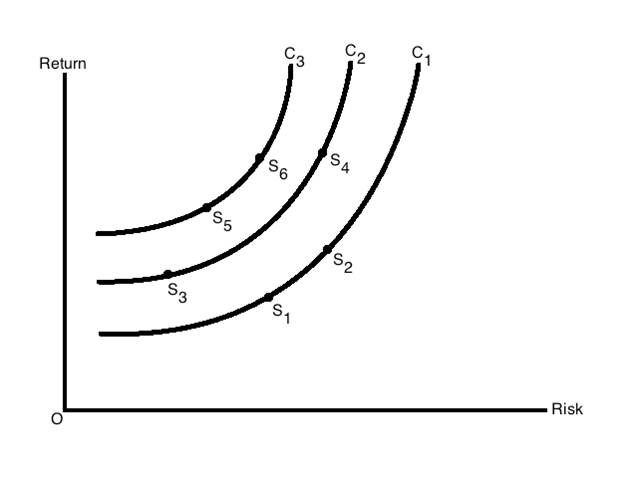 Indifference Curves for an Investor
Note that each of the curves (C1, C2, and C3) represents different levels of utility for the investor. However, on any one indifference curve, the utility is the same anywhere on the curve. For example, on indifference curve C1, the investor gets same level of utility (satisfaction) at both points S1 and S2. Similarly, the utility is the same at S3 and S4.
Now let’s compare points S4 on C2 and S6 on C3. On point S4, the investor faces a certain amount of risk for certain return. On point S6, he gets the same return as on S4 but at lower risk. So, given a choice, he can increase is utility by moving to the indifference curve C3.
In general, the utility of risk-averse investors increases as we move leftwards in the graph. Given a choice between C1, C2, and C3, the investor would want to be on C3 to maximize this utility.
The indifference curve will have different shape for different types of investors as shown in the following graph.
 Risk Aversion
Related Downloads
Free Guides - Getting Started with R and Python
Enter your name and email address below and we will email you the guides for R programming and Python.