Models of Volatility Clustering: EWMA and GARCH(1,1)
Volatility clustering is one of the most important characteristics of financial data, and incorporating it in our models can produce a more realistic estimate of risk.
Volatility clustering is evident from the fact that today’s volatility is positively correlated with yesterday’s volatility. So, if yesterday observed high volatility, today also we are likely to observe high volatility. This means that volatility is conditional on past volatility (conditional volatility). There are two methods to calculate this:
Exponential Weighted Moving Average (EWMA)
EWMA is a frequently used method for estimating volatility in financial returns. This method of calculating conditional variance (volatility) gives more weightage to the current observations than past observations.
The EWMA estimator is of the form below:
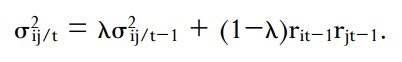
r represents the returns.
λ is the decay factor, also known as the smoothing constant. This factor determines the exponentially declining weighting scheme of the observations. In this way EWMA accounts for the time dependent variances.
λ ensures that today’s variance is positively correlated with yesterday’s volatility. A high lambda indicates slow decay in the series, that is, a high variance will tend to persist for a longer time. RiskMetrics uses a lambda of 0.94 which is appropriate for analysing daily data.
EWMA is actually a subset of GARCH (1,1). [Learn More about EWMA]
Generalized Autoregressive Conditional Heteroscedasticity (GARCH(1,1))
GARCH is another model for estimating volatility that takes care of volatility clustering issue.
GARCH is derived from ARCH, i.e., Autoregressive Conditional Heteroscedasticity. AR means that the models are autoregressive models in squared returns, i.e., there is a positive correlation between the risk yesterday and the risk today. Conditional means that the next year’s volatility is conditional on the information available in this period. Heteroscedasticity means non-constant volatility. It means that the time series of a random variable has a time-varying variance.
G stands for Generalized, which means that it’s a generalized version which can account for different factors in different markets. The most common form of GARCH model is GARCH (1,1). This model is represented as:
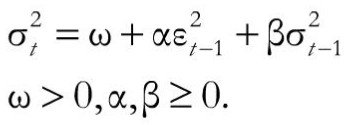
The key concept here is that volatility is a function of squared lagged returns and lagged variances. The term (1,1) indicates this – 1 lag for each squared return and squared variance of previous day.
where: α is the weight for lagged squared returns β is the weight for lagged variances ω is a constant equal to γ x VL where VL is the long run variance rate and γ is its weight
Free Guides - Getting Started with R and Python
Enter your name and email address below and we will email you the guides for R programming and Python.