Lessons
- Descriptive Vs. Inferential Statistics
- Types of Measurement Scales
- Parameter, Sample Statistic, and Frequency Distribution
- Relative Frequencies and Cumulative Relative Frequencies
- Properties of a Data Set (Histogram / Frequency Polygon)
- Measures of Central Tendency
- Calculating Arithmetic Mean
- Calculating Weighted Average Mean
- Calculating Geometric Mean
- Calculating Harmonic Mean
- Calculating Median and Mode of a Data Set
- Quartiles, Quintiles, Deciles, and Percentiles
- Range and Mean Absolute Deviation
- Variance and Standard Deviation
- Chebyshev’s Inequality
- Coefficient of Variation
- Sharpe Ratio
- Skewness and Kurtosis
- Relative Locations of Mean, Median and Mode
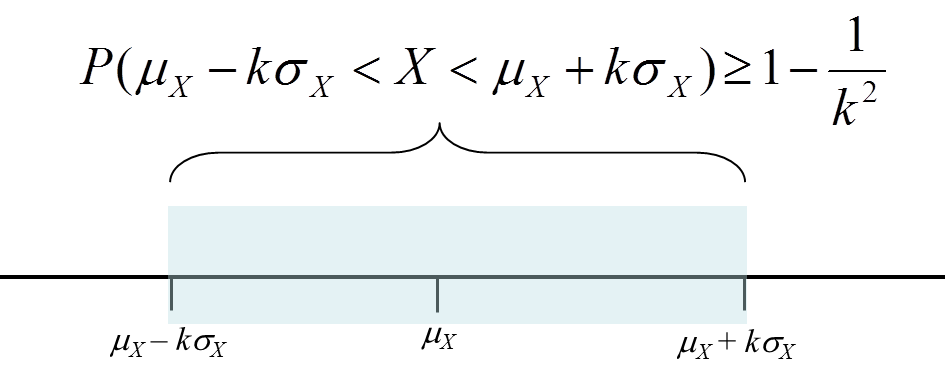
Chebyshev’s Inequality
Chebyshev’s Inequality is used to describe the percentage of values in a distribution within an interval centered at the mean.
It states that for a distribution, the percentage of observations that lie within k standard deviations is atleast 1 – 1/k2
This is illustrated below:
Example
The following table shows the minimum number of observations that lie within a certain number of standard deviations of the mean.
| Standard Deviations | % of observations |
| 1.5 | 56% |
| 2 | 75% |
| 3 | 89% |
| 4 | 94% |
An important feature of Chebyshev’s Inequality is that it works with any kind of distribution.
Related Downloads
Related Quizzes
Finance Train Premium
Accelerate your finance career with cutting-edge data skills.
Join Finance Train Premium for unlimited access to a growing library of ebooks, projects and code examples covering financial modeling, data analysis, data science, machine learning, algorithmic trading strategies, and more applied to real-world finance scenarios.
I WANT TO JOINJOIN 30,000 DATA PROFESSIONALS
Free Guides - Getting Started with R and Python
Enter your name and email address below and we will email you the guides for R programming and Python.